
Learn
Examples
Probistica has 20 example models. Each one has numbered steps on its sheet: what to select and what to click.
Open an example in Excel
On the Probistica tab, click Examples. Select an example and click Make workbook. Probistica makes a new workbook with the model. No open workbook changes. Save the new workbook to keep it.
To run an example, join early access for the free 15-day trial when the signed release ships (without Probistica installed, Excel shows #NAME? for SIM.* formulas).
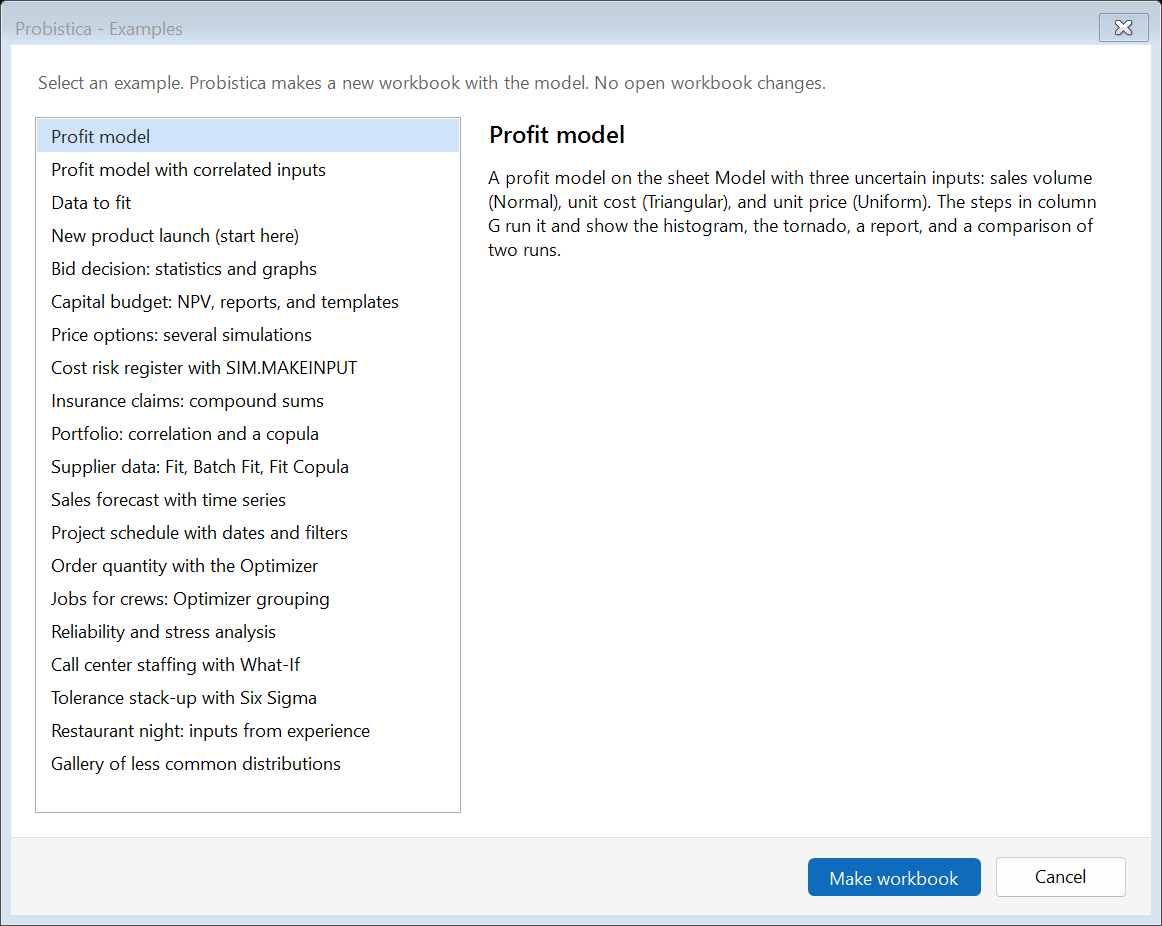
The 20 examples
| Example | Shows | Description |
|---|---|---|
| Profit model | Simulation, charts, reports | A profit model with three uncertain inputs: sales volume (Normal), unit cost (Triangular), and unit price (Uniform). The steps run it and show the histogram, the tornado, a report, and a comparison of two runs. |
| Profit model with correlated inputs | Correlation | The profit model with a rank correlation matrix of its three inputs on the sheet Corr (SIM.CORRMAT). The steps run it with and without the correlations and compare the two runs. |
| Data to fit | Fitting | 40 waiting times for Fit and a series of 60 values (an AR(1) sample) for Time Series Fit. The steps write a distribution fit and a 12-step forecast onto the sheet. |
| New product launch (start here) | Simulation | Start here: a first-year profit model with PERT, Beta General, Triangular, truncated Normal, and Bernoulli inputs. The steps use Define Distribution, Define Output, Model Window, Issues, Settings, Run, and Charts. |
| Bid decision: statistics and graphs | Results | A bid against two rivals, with statistics and a histogram on the sheet (SIM.MEAN, SIM.PERCENTILE, SIM.CIMEAN, SIM.THEOMEAN, SIM.RESULTSGRAPH). The steps run the model and use Goal Seek to find the bid with a 60% chance to win. |
| Capital budget: NPV, reports, and templates | Reports | A 5-year NPV and IRR with expert inputs (SIM.TRIGEN, Alt forms, SIM.BETASUBJ) and a convergence test. The steps make a report, a template sheet report, and a run with a locked input. |
| Price options: several simulations | Several simulations | Four monthly prices of a coffee subscription in one run with SIM.SIMTABLE. The steps set four simulations, chart and compare them, and make a summary report. |
| Cost risk register with SIM.MAKEINPUT | Simulation | A clinic cost with four base costs and a risk register of chance times impact. SIM.MAKEINPUT groups the risks, and the steps show the two groups in the tornado. |
| Insurance claims: compound sums | Distributions | Annual claims of four insurance lines as compound sums (SIM.COMPOUND), with a deductible, a limit, and a spliced storm loss. The steps compare the simulated and exact means and list the worst years. |
| Portfolio: correlation and a copula | Correlation, copulas | Five asset returns: three share a rank correlation matrix, and two share a Clayton copula. The steps check the correlations, run without them, and correct an invalid matrix. |
| Supplier data: Fit, Batch Fit, Fit Copula | Fitting | 40 past orders (lead time, unit price, defect rate) and an order cost with a live fit of the lead time. The steps use Fit, Batch Fit, Fit Copula, and Fit Manager. |
| Sales forecast with time series | Time series | 48 months of units and prices on the sheet Sales_data, and a 12-month profit plan. The steps fit both series, write them into the plan, and show how to type a series. |
| Project schedule with dates and filters | Results, filters | A worksheet model of an office move, with uncertain task durations and dates and two correlated tasks (SIM.DEPC). The steps chart the finish date and use Filters to show the mean cost of the late trials. It does not import a file from a project-planning program. |
| Order quantity with the Optimizer | Optimization | How many Christmas trees to order when demand is uncertain. The steps let the Optimizer search for a strong order quantity, and Advanced Sensitivity then compares four orders. |
| Jobs for crews: Optimizer grouping | Optimization | Six jobs with uncertain hours for three crews. The steps let the Optimizer (Grouping method) assign the jobs so that the busiest crew finishes sooner. |
| Reliability and stress analysis | Stress | A pump station with two pumps in parallel, a controller and a power unit in series, a shaft fatigue life, failed starts, and a peak pressure against the pipe strength. The steps run it and use Stress to test weak controllers and a higher peak pressure. |
| Call center staffing with What-If | What-If | One day of a call center with uncertain calls, absence (a Multi form), minutes per call (SIM.VARY), breaks, and supervisors. The steps use What-If to show how the roster and the absence rate change unanswered calls and cost. |
| Tolerance stack-up with Six Sigma | Six Sigma | A gearbox stack-up of a housing, four parts, and thermal growth, with Six Sigma statistics of the end gap (SIM.SIXSIGMA, SIM.CPK) and a lot sample (SIM.HYPERGEO). The steps show the Six Sigma tab, run the model, and improve Cpk. |
| Restaurant night: inputs from experience | Distributions | A Friday night with inputs from experience: past data (SIM.RESAMPLE), tables (SIM.DISCRETE, SIM.CUMUL, SIM.HISTOGRM), and curves. The steps use random static values, Artist, and Trial Data. |
| Gallery of less common distributions | Distributions | Thirteen less common families, each with its theoretical mean and percentiles before a run. The steps compare the shapes in Define Distribution and the sample means with the theory. |