
Features
Sensitivity and charts
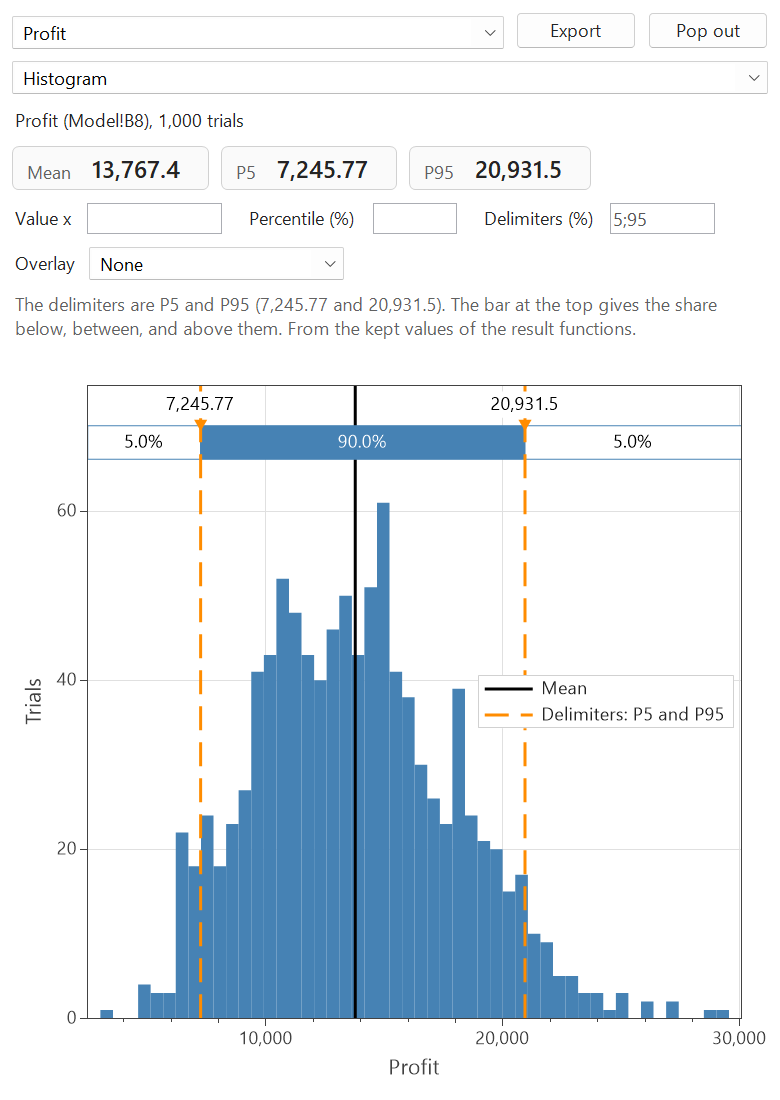
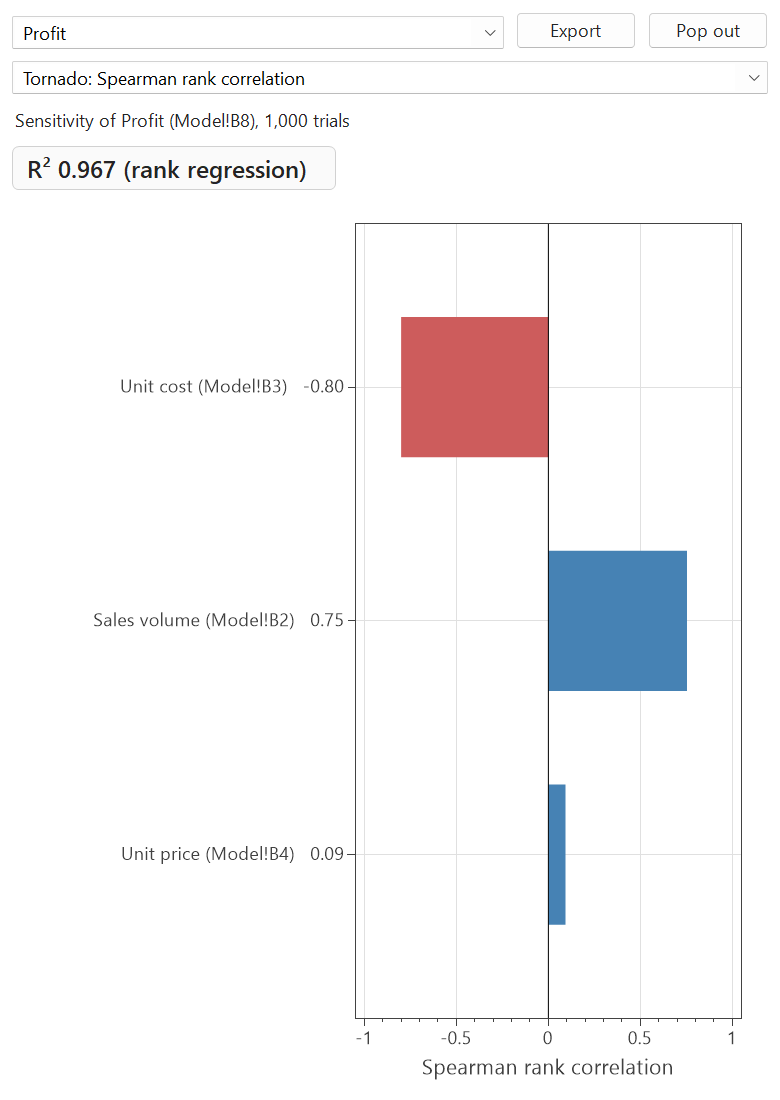
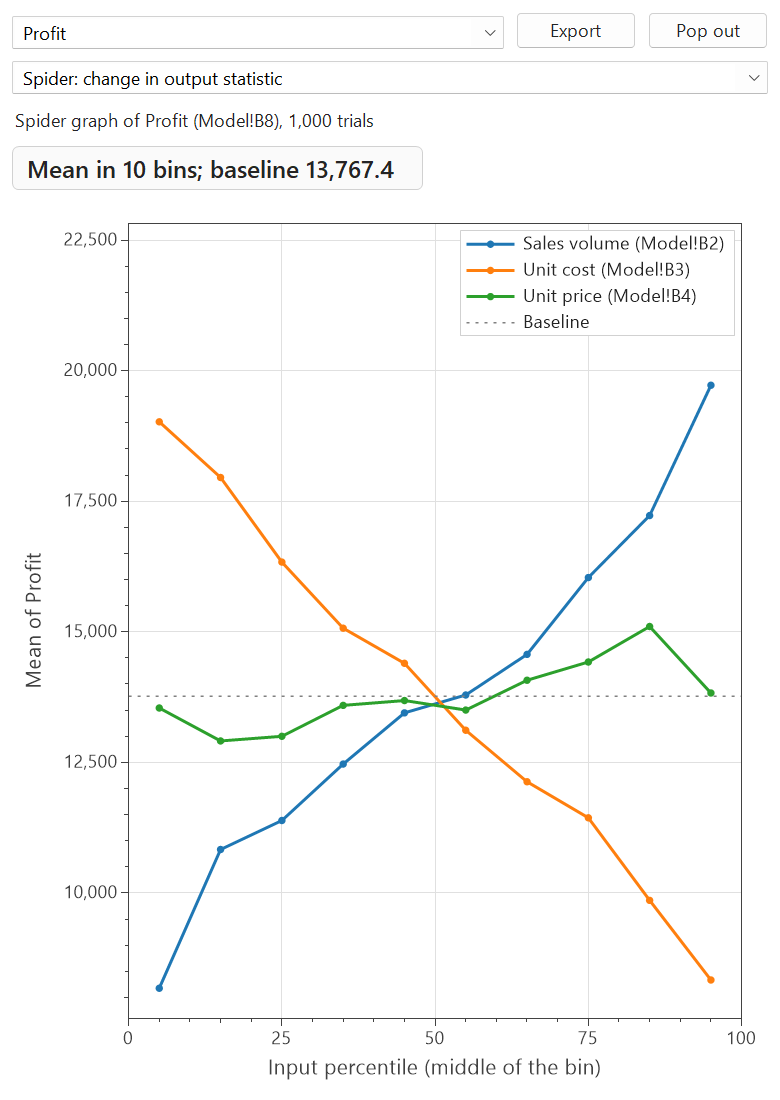
After a run, Probistica writes a results sheet and opens a chart pane. See the distribution of each output and the inputs that drive it.
The results sheet
For each output, the results sheet shows:
- The mean, the standard deviation, the minimum, the percentiles, and the maximum.
- The precision of the mean and of P5 and P95 (Monte Carlo runs).
- Sensitivity: Spearman rank correlation, rank regression, stepwise regression, contribution to variance, and the change of the output statistic by input bin.
- Scenario analysis: which inputs are high or low when the output is in its top 10%.
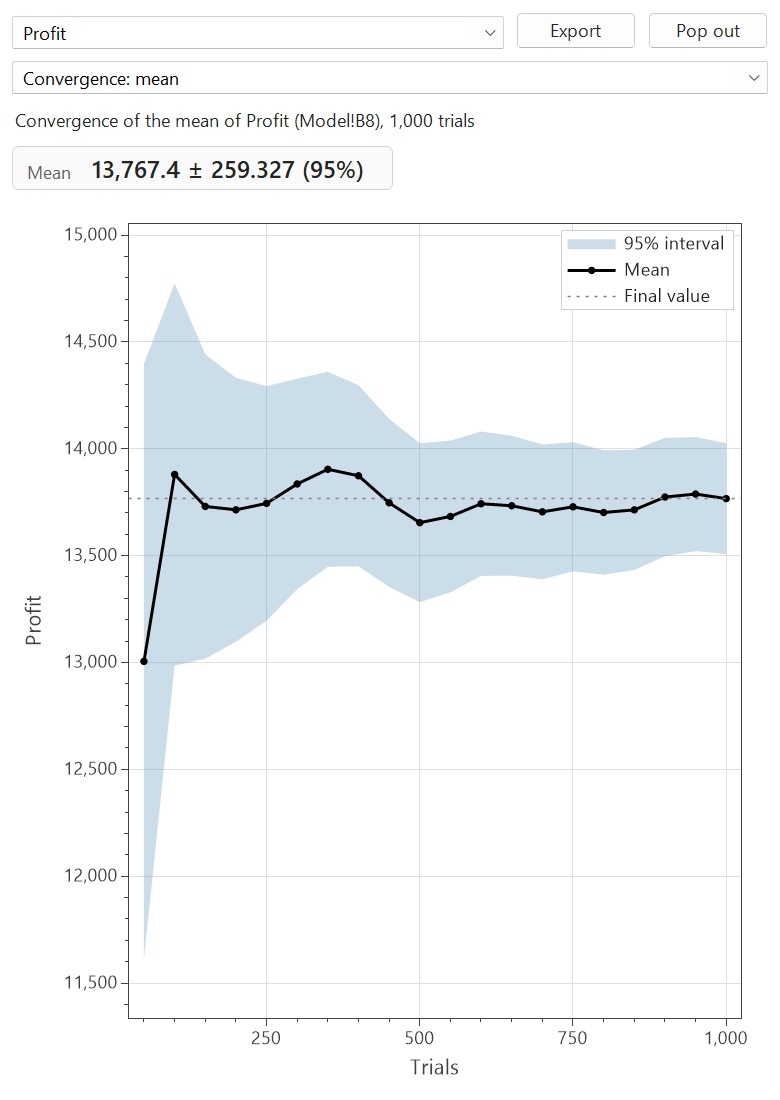
- The convergence of the mean, P5, and P95, the correlation check, and the run details (seed, trials, method, and timings).
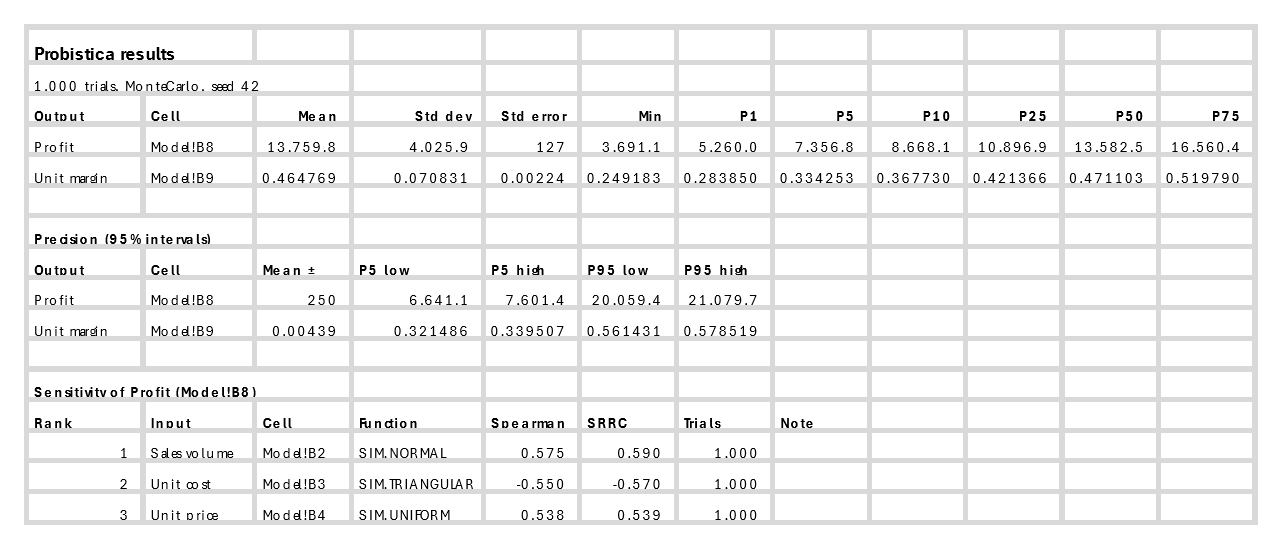
Probistica Results 1 exported from Excel: summary statistics, 95% precision intervals, and sensitivity rankings.The chart pane
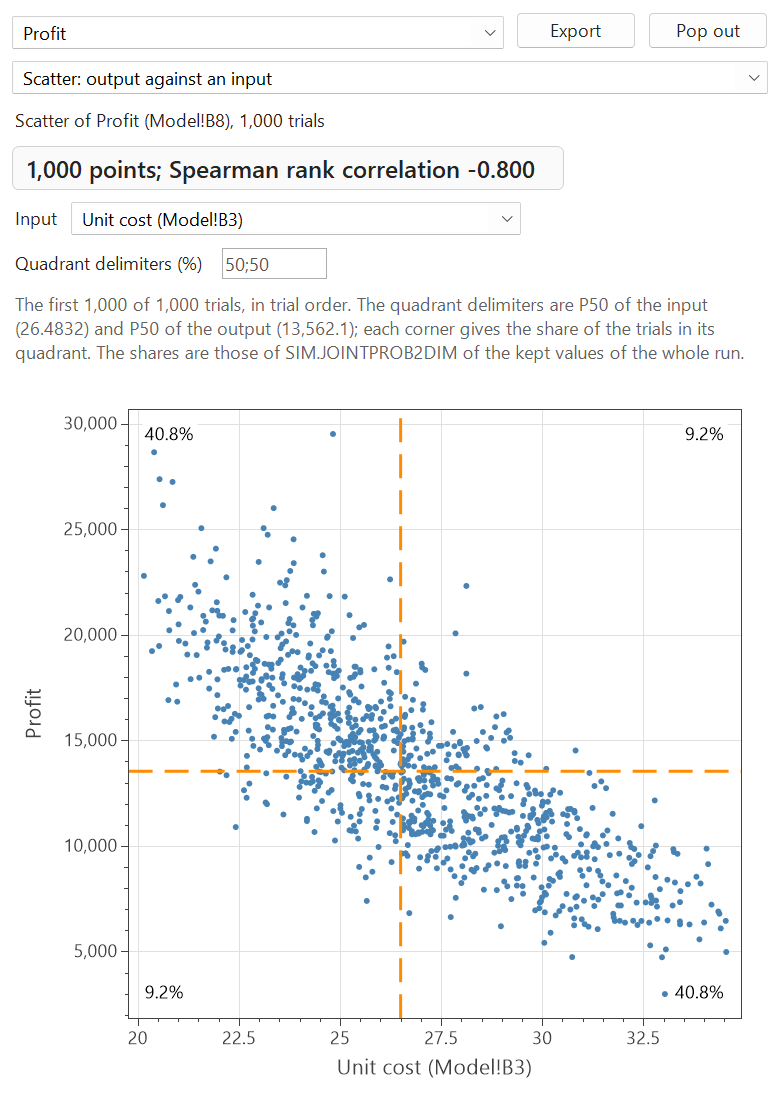
Click Charts to open the pane. Choose the output and the chart type. Pop out opens a chart in its own window, and Export saves it.
More ways to read results
Result functions
Show a statistic in any cell, for example SIM.MEAN, a percentile, or a target probability. They update after each run.
Graphs in cells
SIM.RESULTSGRAPH draws a graph of a result on a sheet, for example in a report template.
Compare
Compare two results sheets: the differences of the statistics, a test for two independent runs, and every setting that differs.
Filters
Define filters to look at a part of the trials, for example only the trials with a loss.
Summary graphs
Show box plots of several outputs side by side.
Six Sigma statistics
Give an output its specification limits and get Cp, Cpk, and the other Six Sigma statistics.