
Features
Simulation and distributions
Describe each uncertain value with a distribution, link the inputs that move together, and run the model for thousands of trials.
Distribution functions in cells
Type a distribution function in a cell, or use the Define Distribution window. In Excel, the cell shows the mean of the distribution. During a run, Probistica draws a new value in each trial.
- More than 50 continuous and discrete families, for example Normal, Triangular, PERT, Lognormal, Gamma, Weibull, Beta, Poisson, Binomial, and Discrete.
- Alternate forms for 24 continuous families: give percentiles instead of parameters.
- Your own shapes: Cumul, General, Histogram, Discrete, and Resample of your data.
- Compound sums for insurance and loss models, and spliced distributions for a different tail.
- Truncation, shift, locks, names, categories, and units as properties of an input.
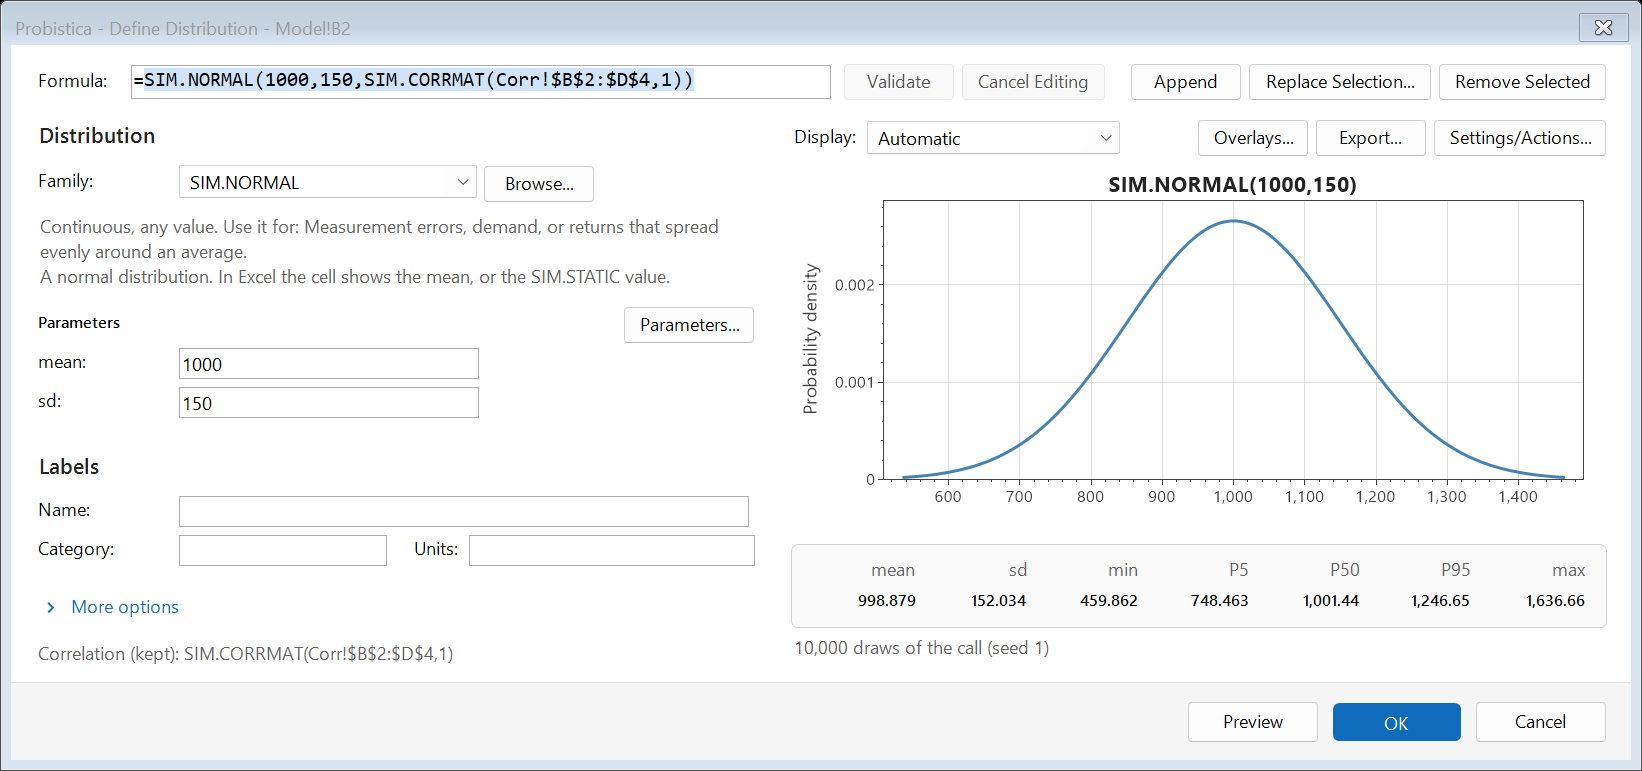
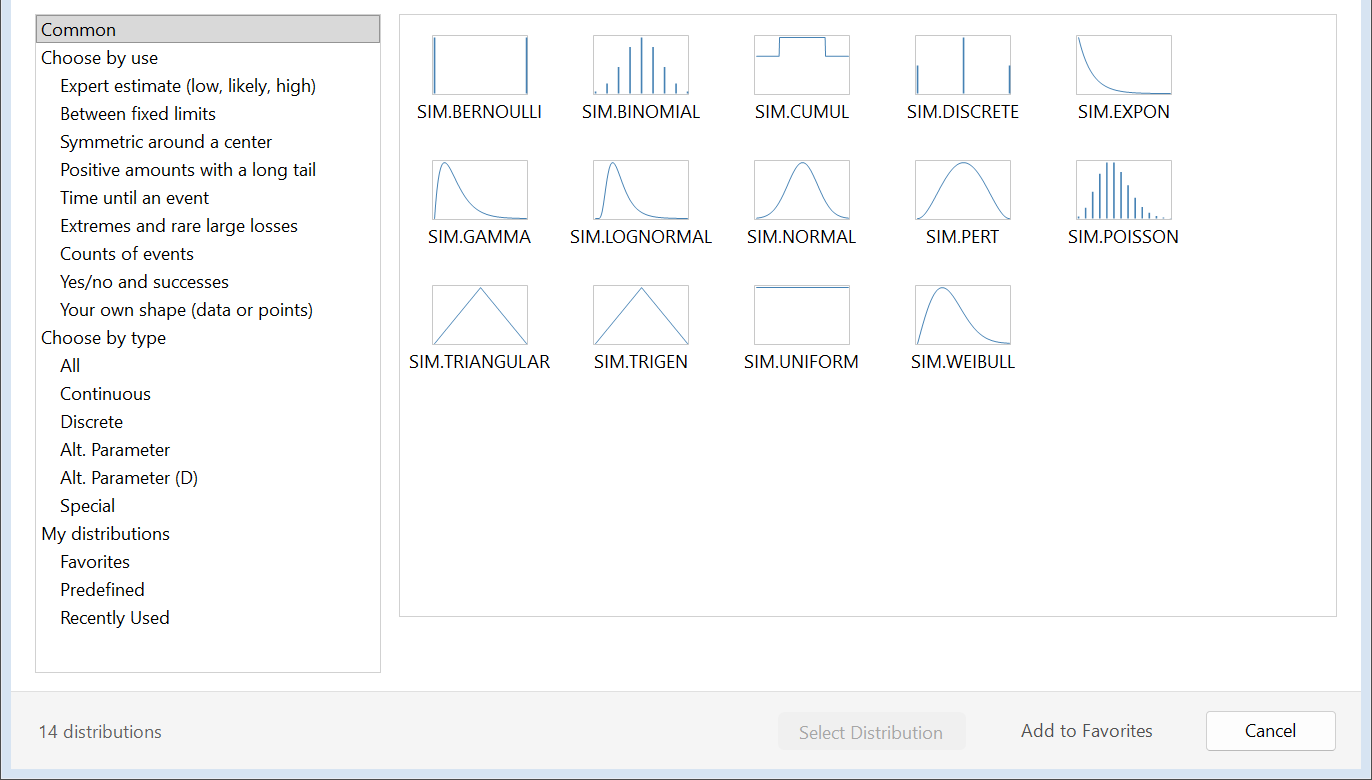
Find the right distribution
The Select Distribution window sorts the families by use. Choose for example "Expert estimate (low, likely, high)", "Time until an event", or "Extremes and rare large losses". Favorites, predefined distributions, and the recently used families are one click away.
The Distribution Artist lets you draw a curve with points and write it as a distribution.
Correlation and copulas
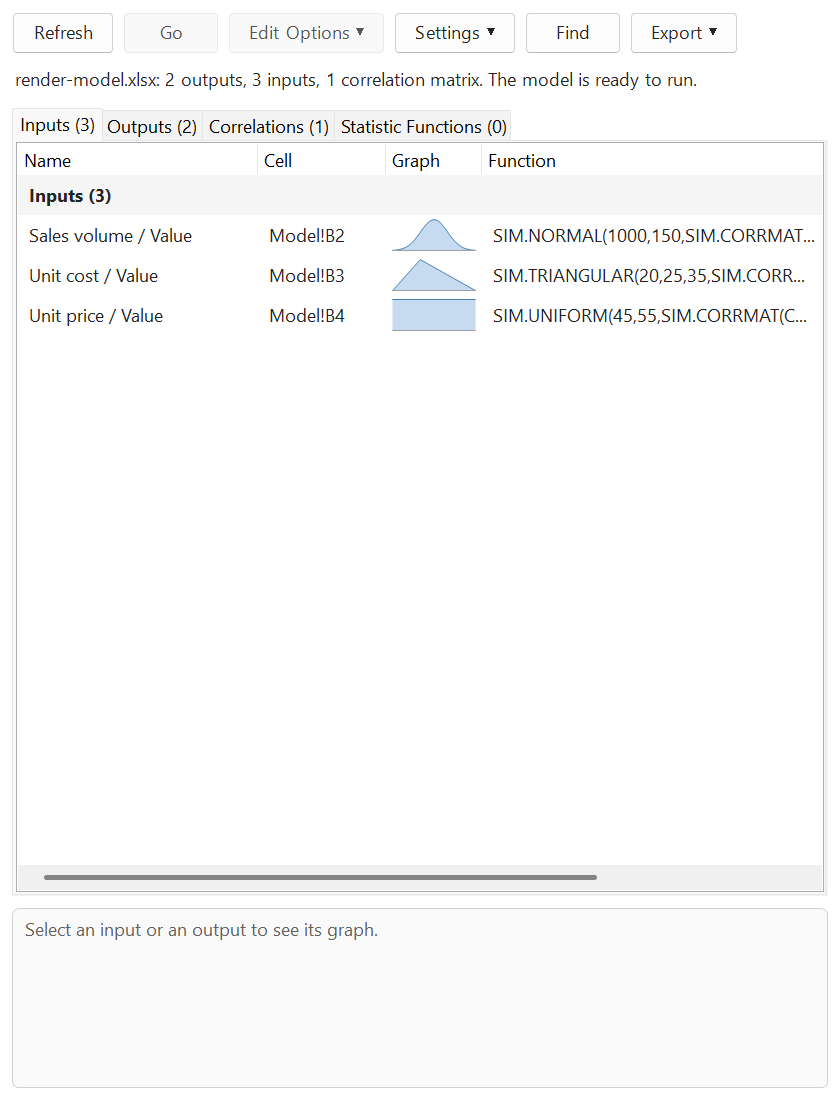
Inputs that move together need a dependence. Put a rank correlation matrix in cells and add SIM.CORRMAT to each input. The results sheet shows the target and the achieved correlation of each pair.
- Correct Matrix makes a valid matrix from one that is not valid. Probistica never changes your matrix without your command.
- Copulas give a dependence that a correlation matrix cannot give, such as a strong dependence in one tail: Gaussian, t, Clayton, Gumbel, and Frank, with rotated forms.
Run settings
Sampling
Monte Carlo is the default for a new workbook. Latin Hypercube sampling is available in Settings. A seed makes a run repeatable.
Speed
In the default trial mode, the Probistica engine calculates the trials itself when it can. It can use all processor cores, and the results do not depend on the number of threads. With a macro in each trial, Excel calculates each trial, and the run is much slower.
Convergence
Monitor the mean and percentiles during the run. Optionally, stop the run when all outputs converge.
Several simulations
SIM.SIMTABLE gives one value for each simulation. One click runs all simulations and writes one results sheet for each.
Checks before a run
Issues checks the model. A formula outside the supported set stops the run and names the cell.
Your macros
Excel trial mode runs your macros before or after each trial or simulation, and calculates the formulas that the engine does not support.
The user guide lists each function with its parameters, and the limits of this release.